Tuesday, November 21, 2023
Tuesday, August 29, 2023
Data Dictionary - Defines fields used in Oracle Primavera Cloud.
Data Dictionary - Defines fields used in Oracle Primavera Cloud.
Any user who wants to understand the meaning of fields should consult this dictionary, as needed.
Tuesday, June 6, 2023
How to create a critical activity indicator in P6 Pro
https://tensix.com/how-to-create-a-critical-activity-indicator-in-primavera-p6/
Credit to TenSix Consulting
Create a Critical Activity Indicator in the Activity Table
Identifying critical activities in your schedule is paramount in preventing delays that, if left unchecked, can ultimately de-rail your project. Although critical activities are displayed in the Gantt Chart, (typically with red Gantt chart bars) it not always easy keeping an eye on them, especially if you have a complex schedule. Another useful thing you can do in Primavera P6, is to create a Critical Activity Indicator in the activity table left of the Gantt chart.
With the combination of global change and a Critical Activity Indicator, Primavera P6 will provide a graphical display in the activity table, of all the critical activities in your schedule. Once the indicator is inserted in the activity table, it only takes a moment to identify any activities that may be critical.
In this article, we will demonstrate how to create a Critical Activity Indicator, run a Global change and display the activity results with the UDF Indicator in the activity table.
In our demonstration project, below in Figure 1, we can see our critical activities displayed in the Gantt chart.
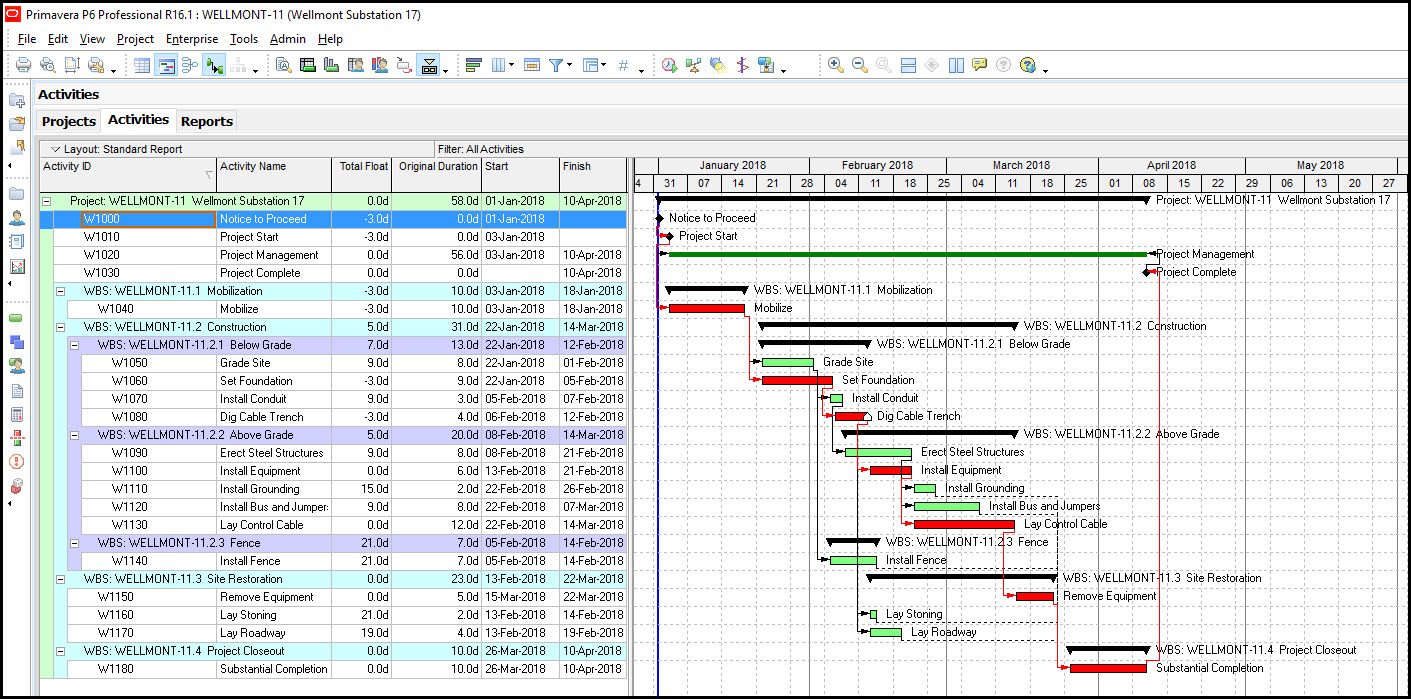 Figure 1
To be able to quickly reference the critical activities within the activity table, we need to create a User Defined Field (UDF). We select ‘Enterprise’ and ‘User Defined Fields’. In the UDA dialog box, we select ‘Critical Indicator’ from the ‘Titles’ field, and from ‘data-type’ we select ‘Indicator’, as shown below in Figure 2.
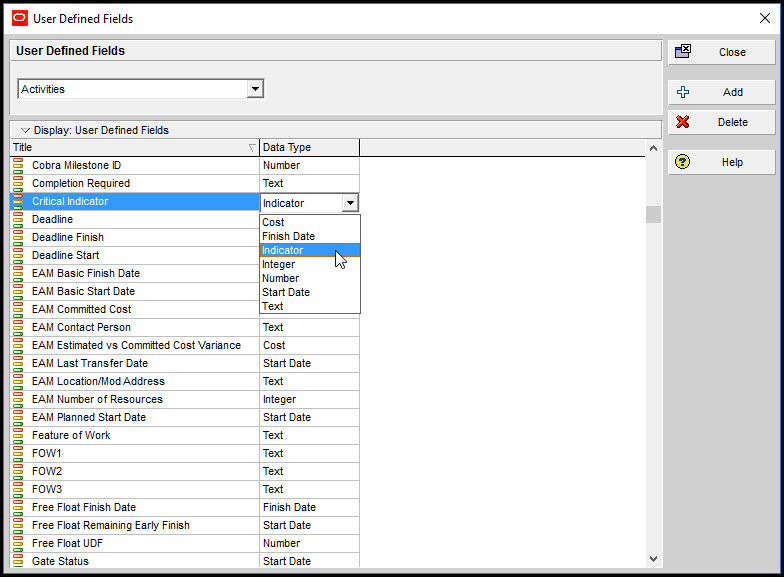 Figure 2
We associate all of our activities with our newly created UDF called ‘Critical Indicator’.
We need to analyze all of our activities to determine whether they are critical by creating a global change routine. We select ‘Tools’ and ‘Global Change’ and in the dialog, we select ‘+ New’.
In the ‘Modify Global Change’ dialog box, in the ‘Select Subject Area’ box at the top left-hand side of the screen we select ‘Activities’ and for the top right-hand side box, ‘Global Change Name’ we type ‘Set Global Indicator’, as shown below in Figure 3.
The equivalency is ‘Where Critical equals Yes’. Primavera P6 will analyze each activity and identify whether it is critical (the UDF indicator will turn red) or non-critical (the UDF indicator will turn green) based upon the parameter settings for the activities.
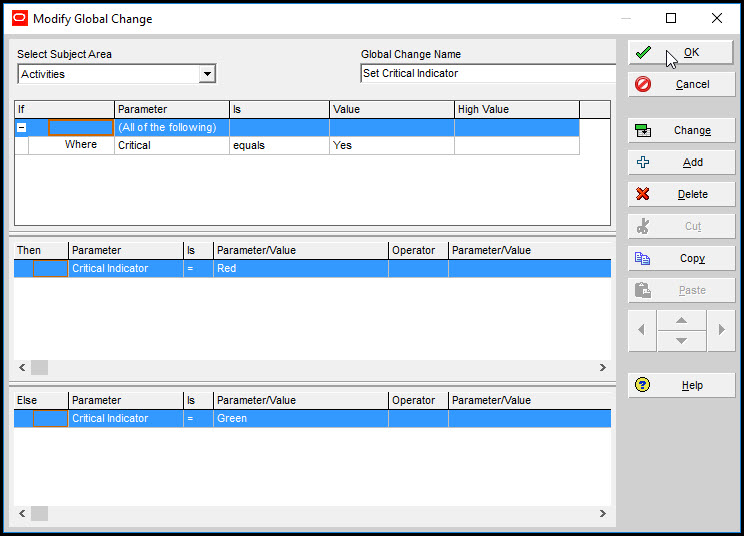 Figure 3
Finally, we insert our Critical Indicator UDF as a column in our activities table. When we run the Set Critical Indicator global change routine, we can see the Critical Indicator list displayed in our schedule, as shown in Figure 4.
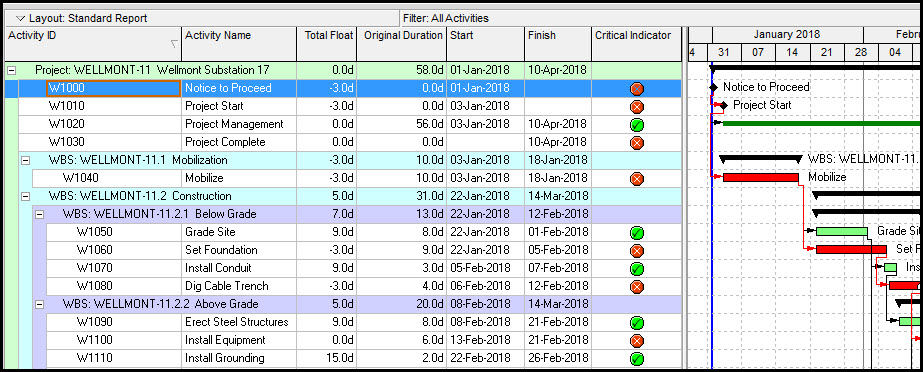 Figure 4
SUMMARY
Creating a Critical Activity Indicator in Primavera P6 is a fairly simple two-step process. First, create the Critical Activity Indicator and then create the global change routine. Primavera P6 will analyze all the activities in your schedule and when the Indicator is inserted in your activities table all any critical or non-critical tasks will be displayed at a glance.
The Critical Indicator is beneficial in monitoring and tracking tasks, alerting you to any delays that may occur in your schedule.
USING THE P6 CHECK SCHEDULE TOOL
Link to article https://tensix.com/using-the-p6-check-schedule-tool/
Credit TenSix Consulting
The DCMA 14-Point Assessment is an industry standard to measure schedule quality. Schedule’s that are judged high quality by the DCMA 14-Point Assessment have a significantly higher probability of success. The 14-Point Assessment seal of approval ensures a well-built, and, therefore, practical schedule. So, the DCMA 14-Point Assessment is an indispensable guideline to confirm schedule health or expose areas needing improvement.
The P6 check schedule tool employs most (not all) of the DCMA 14-Point Assessments to efficiently measure these project quality metrics in relation to their targets. This P6 check schedule tool, when properly understood and applied, can have a huge constructive effect on the success of your project.
This article demonstrates the P6 check schedule tool in Primavera P6 Professional r22.12 and investigates its utility as an efficient and effective schedule health diagnostic tool.
We have in Figure 1 our demonstration schedule.
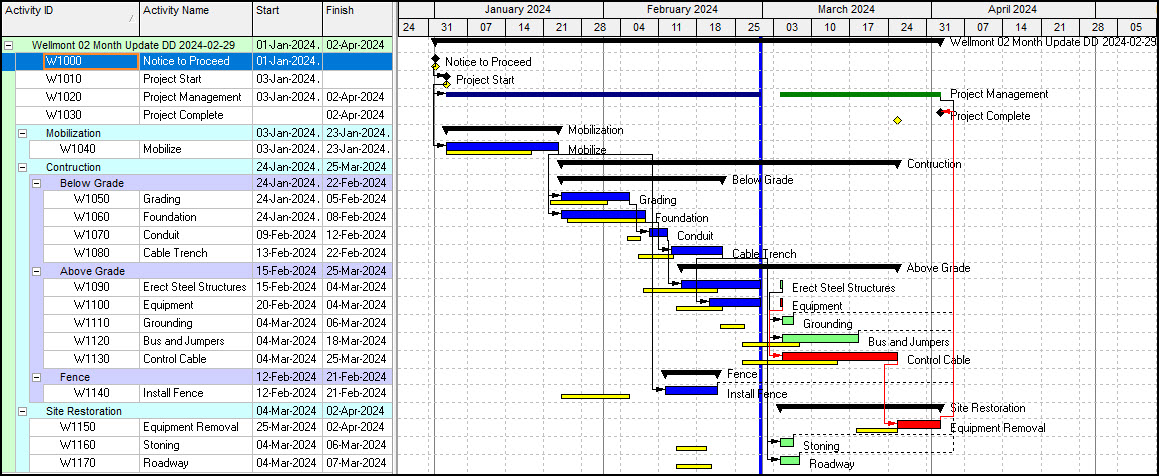 Figure 1
This schedule has two months progress. The yellow bars on the Gantt chart denote the baseline. The blue bars are completed work. The vertical blue line at the end of February is the data date (status date).
We proceed with the check schedule by choosing Tools | Check Schedule Report, Figure 2.
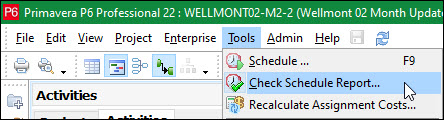 Figure 2
In the Check Schedule dialogue, Figure 3, we have a list of the checks P6 Professional performs.
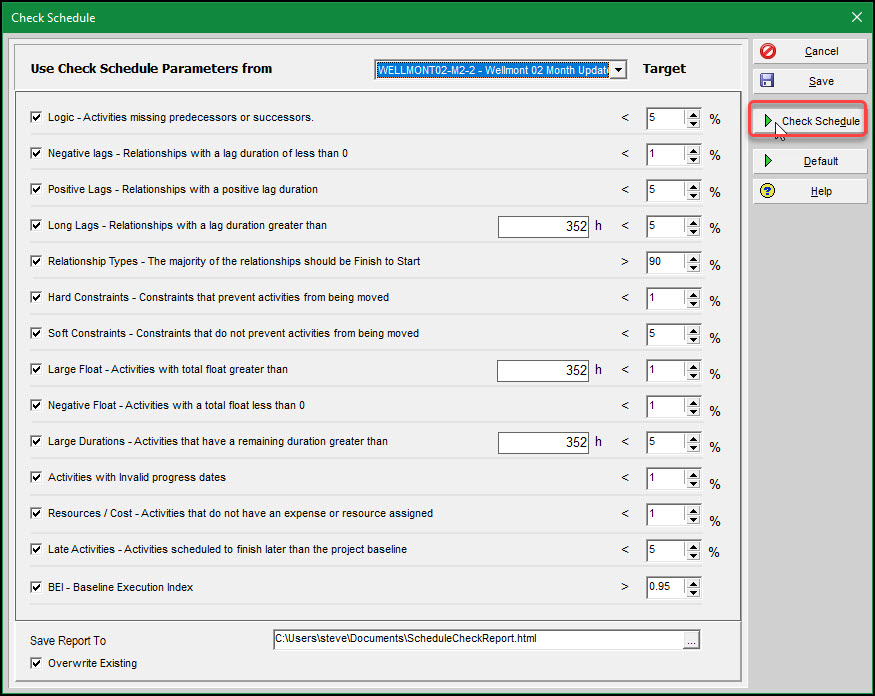 Figure 3
Oracle added three additional assessments: Long Lags, Soft Constraints, and Late Activities. It also did not include three DCMA 14-Point assessments: Missed Tasks, Critical Path Test (CPT), and Critical Path Length Index (CPLI). For the assessments that are included make sure the targets are in your desired range, then click Schedule. The following dialogue then appears, Figure 4.
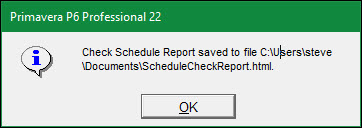 Figure 4
Click OK, then a summary of the Check Schedule output appears, Figure 5.
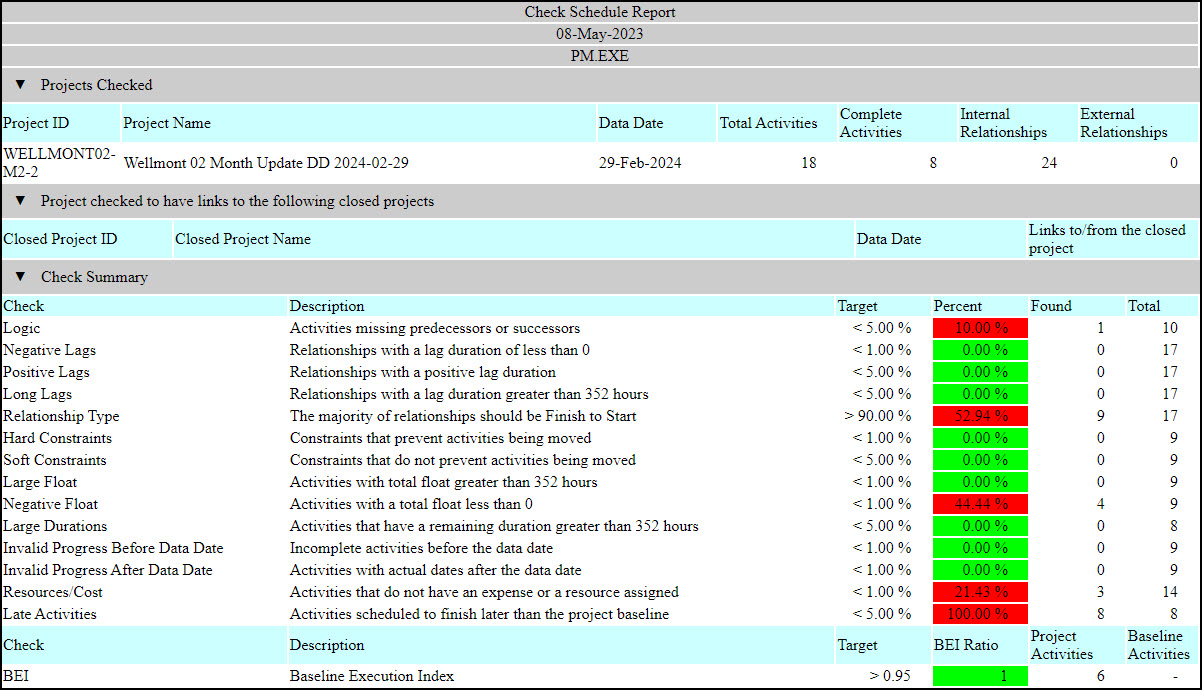 Figure 5
The Check Schedule Report registers 18 activities in the schedule. The number of completed tasks is 8. Each schedule check is listed along with a description, target, percent, tasks found, and total tasks examined in the schedule, Figure 5. A summary of each check output follows:
Logic
Two activities in the schedule have missing logic. The W1000 Notice to Proceed task has no predecessor and the W1030 Project Complete task has no successor. The Check Schedule Report only reports one activity missing logic. This is because the Check Schedule Logic analysis only considers remaining work. The W1000 Notice to Proceed task is complete, so it is excluded from the check.
Ten percent of the tasks in the demonstration schedule are missing logic. This is one activity out of the ten that have remaining work. The target of less than 5% is exceeded. The schedule fails the Logic check. Figure 6 lists the tasks failing the logic check.
 Figure 6
As Project Complete is the last scheduled activity, we would not expect it to have a successor. This task is better excluded from the Logic check, but the P6 Professional Logic check has no means for manually excluding tasks from the analysis. Be aware, therefore, that your Logic score may be slightly worse than truly warranted. In this case the schedule would have passed if not for the Project Complete milestone with no successor.
Negative Lags
There are no tasks with negative lag. Note that the total activities included in this inspection is 17 and not 18; the level of effort (LOE) activity is not included in the total count for negative lags. The duration of the LOE task is dependent on its underlying associated activities and does not have lag.
Positive Lags
No tasks have positive lag. Again, the total activities included in this inspection is 17 and not 18; the LOE activity is not included in the total count for positive lags.
Long Lags – Additional Check
No tasks in the schedule have Long Lags. The Long Lags check does not appear in the DCMA 14-Point assessment but is a useful check. The total activities included in this check is 17 and not 18, because the LOE task is not a part of the total count. LOE tasks do not have lag.
Relationship Type
The schedule Relationship Type check for the number of finish-to-start (FS) relationships in the schedule has a percentage of 52.94%, a failing score. The target is for 90% or more of the relationships to be FS. Figure 7 lists each relationship type and their percentage in the schedule.
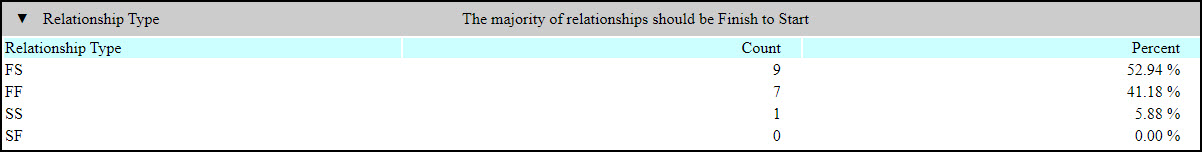 Figure 7
Figure 5 says 17 tasks are included in the total relationship count for the Relation Type check. Only relationships associated with tasks with remaining work are included in the total relationship count.
Hard Constraints
There are no hard constraints in the schedule. Note that the total count is 9, which includes the 8 task dependent tasks with remaining work (Note that W1140 Install Fence is complete.) and the Project Complete finish milestone.
Soft Constraints – Additional Check
There are no soft constraints. The Soft Constraints check is an additional test. The total includes the same nine task dependent and milestone remaining work tasks included in the hard constraints total.
Large Float
There is no Large Float activities, and the total, again, comes to nine. The target for Large Float is 352-h or 44-d which comes to two months’ worth of business days.
Negative Float
Figure 8 displays the total float of each task in the schedule.
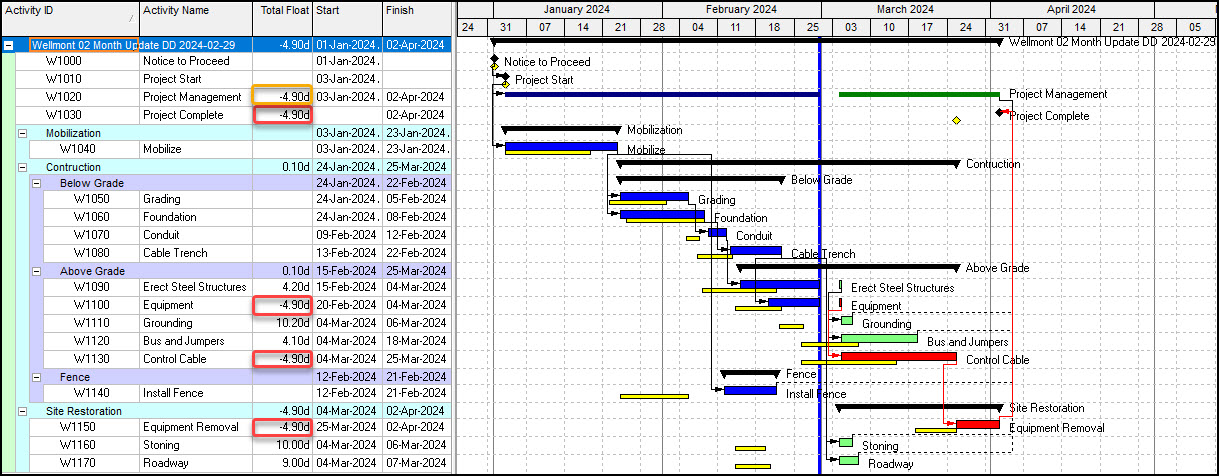 Figure 8
Four activities flag (red) for the Negative Float inspection, Figure 5. Observe that a fifth activity flags (yellow) for negative float, but it is not included in the Negative Float count because it is a LOE task. Remember, the duration of the LOE activity is dependent on its underlying tasks. The total count included in the assessment is, again, nine.
The percentage activities with negative float is 44.44% which fails the assessment by a wide margin. After progressing the schedule for two months, it has become a schedule in trouble.
Large Durations
There are no Large Duration tasks in the schedule. The Large Durations tasks assessment only considers remaining work. Milestones and LOE tasks are not included. Remember that task W1140 Install Fence is complete, so it does not add to the total. The target, again, is 352-h or 44-d business days.
Invalid Dates
The invalid dates assessment output has two separate results: Invalid Progress Before Data Date and Invalid Progress After Data Date. So, you should not have incomplete work to the left of the data date. This is Invalid Progress Before Data Date. You also should have no completed work to the right of the data date, which is Invalid Progress After Data Date. Both have a total activity count of 9, which is the remaining work with milestones and not LOE tasks.
Resources/Cost
This assessment inspects all task dependent activities, so milestone and LOE activities are not included. Any task that does not have a labor cost associated with it is flagged. Fixed price (or lump sum) costs on activities do not count as cost loadings. You can assign a lump sum cost as a labor resource, which will register. Refer to the blog “USACE SDEF Format and Cost Loading a P6 Schedule” for an article on how to cost load a task using a lump sum labor resource.
Late Activities – Additional Check
The Late Activities check is not in the DCMA 14-Point Assessment. It is a measure of how well the project executes according to plan. Any task currently scheduled to conclude later than its baseline finish date flags. The magnitude of the delay is irrelevant, so tasks with only minor delays flag for this assessment. This no exceptions strict adherence to the baseline finish date makes this Late Activities progress check sensitive to minutiae; It can obscure the true schedule situation which may be better than the tabulated output data indicates.
The percentage of Late Activities in our demonstration schedule is 100%, so it is apparent that this project is executing poorly.
BEI
The Baseline Execution Index (BEI) is an early warning indicator of how well the project is executing to plan. Other metrics flag all finishes that come after the baseline finish. The BEI is not as stringent. It does not flag tasks that miss their baseline finish dates but nonetheless conclude in the current reporting period. The BEI therefore overlooks minor schedule lapses, but still provides a first alert warning that the schedule is amiss. The equation is as follows:
The numerator is the total number of tasks completed, as per the data date (or status date). The denominator is equivalent to the total number of activities that should have completed on or before the status date. This formula only applies to normal tasks, so we filter out LOE and zero duration tasks (milestones).
A project manager’s major duty is to monitor schedule progress and adjust to keep the project on time. The earlier the project manager can spot a schedule diverting from the plan the better. The BEI has the proper balance between early detection of schedules not proceeding according to plan and too much sensitivity to minor schedule lapses.
The results of the BEI check are in Figure 9.
 Figure 9
The BEI output of one is incorrect. The project activities or total number of tasks complete value of six is correct, but the baseline activities value of six is not. The BEI Ratio of 1.0 is not right. Figure 10 displays the schedule activity table and Gantt chart.
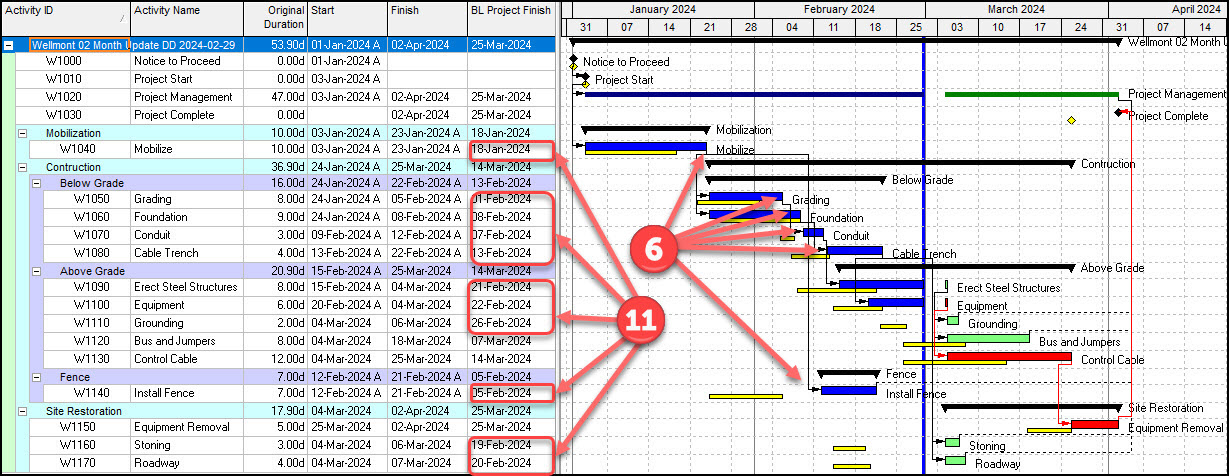 Figure 10
There are 6 tasks that are complete, as per the data date, and 11 that have a planned finish date (see BL Project Finish column) before that same status date. The BEI equates to as follows.
So Primavera P6 Professional incorrectly tabulates the number of tasks having a baseline finish before the data date. This corrupts the BEI computation which erroneously computes to 1, a passing score. The output data for this same schedule using the Check Schedule tool in P6 EPPM is displayed in Figure 11.
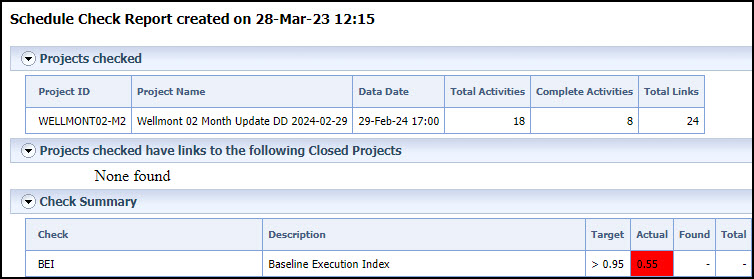 Figure 11
As displayed above, Figure 11, BEI calculated in P6 EPPM correctly computes to 0.55 for this schedule.
SUMMARY
The P6 Check Schedule tool is an incomplete DCMA 14-Point Assessment tool, but nevertheless provides valuable insight into project health. It is incomplete because it does not include the Missed Tasks, CPT, and CPLI assessments.
It is helpful because it does examine many DCMA 14-Point Assessment related schedule attributes which are important to the quality of a schedule.
Important Note: Since writing this blog, Oracle has confirmed that they do plan to correct the BEI equation and include the Missed Tasks, CPT, and CPLI assessments and hope to have it fixed in an upcoming patch release (22.12.6). They are quick to point out that this is tentatively scheduled and is not a guarantee. If it misses this release, it should appear in a later release.
Once fixed, this would make the Check Schedule feature an invaluable tool to verify schedule quality and focus attention on areas requiring improvement. Good scores from the Check Schedule tool, therefore, would help increase the probability of project success.
Another tool that schedulers may want to consider using, are the DCMA 14-Point metrics that come standard with Deltek Acumen Fuse software.
Last, the DCMA 14-Point Assessment guidelines must be properly understood to make the most out of these tools. We recommend you take a look at our free eBook “An Introduction to the DCMA 14-Point Assessment Guidelines”.